This document explains how Multi-IP Ping Monitoring works and outlines the steps to apply it to a resource.
Note: Multi IP Ping Monitoring is not supported in Windows Gateway. This monitor only supports Ubuntu (classic and Next Gen Gateway).
Introduction
Multi-IP Ping Monitoring is a small utility that actively checks device reachability by pinging all physically connected IPs of device. It automatically pings each host at user-defined intervals and reports the device’s reachability status.
Pre-requisites
- Mapping a gateway management profile to the resource is required.
- Add SNMP-type credentials to the resource to retrieve alternative IPs using IP-MIB and HSRP IPs using CISCO-HSRP-MIB.
Template Overview and Business Use Case:
Template: Multiple IPs Ping Reachability Monitor - v2
Business Use Case:
Monitors the device’s reachability by first pinging the management IP. If the management IP is unreachable, it checks reachability using custom parameters specified in the assigned template.
- If the
Include Discovery IPs Listparameter is set to Yes:- The monitor evaluates both:
- The custom IP list provided in the configuration.
- The alternative IPs discovered via SNMP by querying OID
1.3.6.1.2.1.4.20.1.1.
- It retrieves HSRP IPs using OID
1.3.6.1.4.1.9.9.106.1.2.1.1.11and removes them from the discovered IP list. - It combines the filtered discovered IPs with the custom IP list.
- It removes any IPs listed in the Exclude IPs List.
- It pings the final set of IPs:
- If any IP responds, the metric is set to 1 (REACHABLE).
- If none respond, the metric is set to 0 (UNREACHABLE).
- The monitor evaluates both:
- If the
Include Discovery IPs Listparameter is set to No and the management IP is unreachable:- The monitor uses only the custom IP list, if provided.
- If no custom list is available, it retrieves alternative IPs via SNMP by querying OID
1.3.6.1.2.1.4.20.1.1. - It retrieves HSRP IPs using OID
1.3.6.1.4.1.9.9.106.1.2.1.1.11and removes them from the alternative IP list. - It removes any IPs listed in the Exclude IPs List.
- It pings the remaining IPs:
- If any IP responds, the metric is set to 1 (REACHABLE).
- If none respond, the metric is set to 0 (UNREACHABLE).
Note
This monitor is supported from OpsRamp Gateway version 19.2.0 and SaaS version 2025.06-U1 onwards.Examples:
Consider a device with the following IP configuration:
- Management IP: A
- Custom IPs: B, C, D
- IP-MIB IPs: C, D, E, F
- HSRP IPs: F, G
- Exclude IPs: D, H
Case 1: Include Discovery IPs List = Yes
Management IP A is down.
- The monitor considers:
- Custom IPs: [B, C, D]
- IP-MIB IPs: [C, D, E, F] and it removes HSRP IPs [F, G], resulting in IP-MIB IPs: [C, D, E]
- Merged list becomes: [B, C, D, E]
- It removes Exclude IPs [D, H], resulting in final list: [B, C, E]
- If any of the IPs in the final list respond, the device is considered up; otherwise, it's down.
Case 2: Include Discovery IPs List = No
Management IP A is down.
- The monitor considers only:
- Custom IPs: [B, C, D]
- It removes Exclude IPs [D, H], resulting in: [B, C]
- If any of the IPs in the final list respond, the device is up; otherwise, it's down.
Case 3: Include Discovery IPs List = No, and no Custom IPs provided
Management IP A is down.
- The monitor considers:
- IP-MIB IPs: [C, D, E, F] and removes HSRP IPs [F, G], resulting in: [C, D, E]
- Removes Exclude IPs [D, H], resulting in final list: [C, E]
- If any of the IPs in the final list respond, the device is up; otherwise, it's down.
Template: Multiple IPs Ping Reachability Monitor
Business Use Case:
The monitor checks device reachability by first pinging the discovered IP. If discovered IP is unreachable, it checks reachability using multiple IPs defined in the custom parameter during template assignment.
- Monitors device reachability state by pinging device discovered IP at the first step.
- If the discovered IP is not reachable, monitor tries to get the reachability info using multiple IPs provided as part of a custom parameter at the time of template assignment.
- If a custom IPs list is not provided, this monitor will try to get the device IP’s list through SNMP by querying OID
1.3.6.1.2.1.4.20.1.1, and check for the device reachability state. - If any of the IPs are being pinged, then the metric values would be 1 - REACHABLE else 0 - UNREACHABLE.
Apply Multi IP Ping Monitoring on the Device
To apply a Multi IP Ping Monitoring:
- From All Clients, select a client.
- Go to Infrastructure > Resources.
- From the available resources, select the required resource.
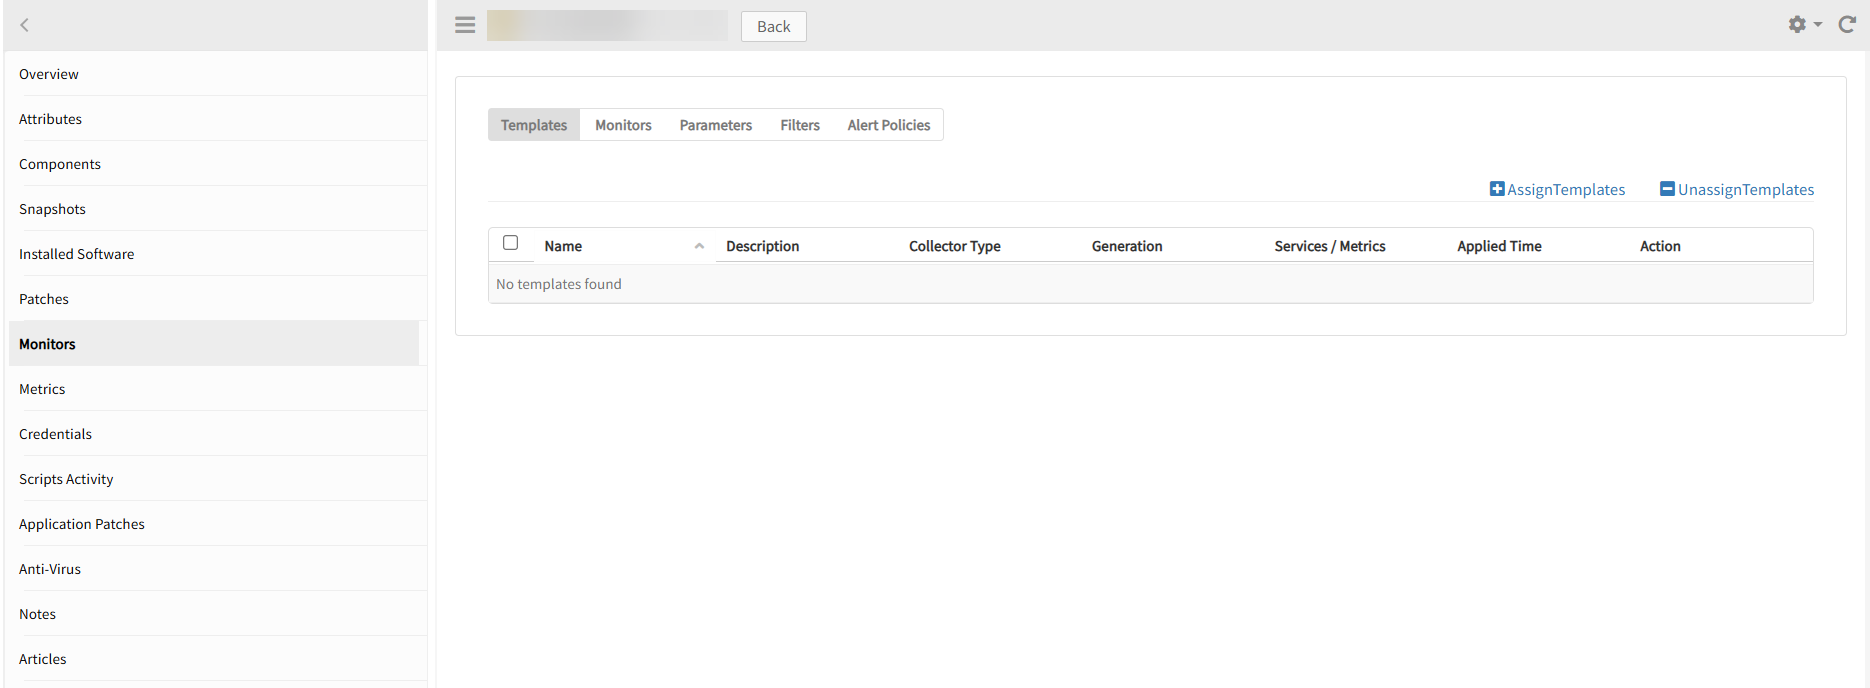
- Select a Monitor from the left side menu. On the Templates screen, click +Assign Templates to open the Apply Templates screen.
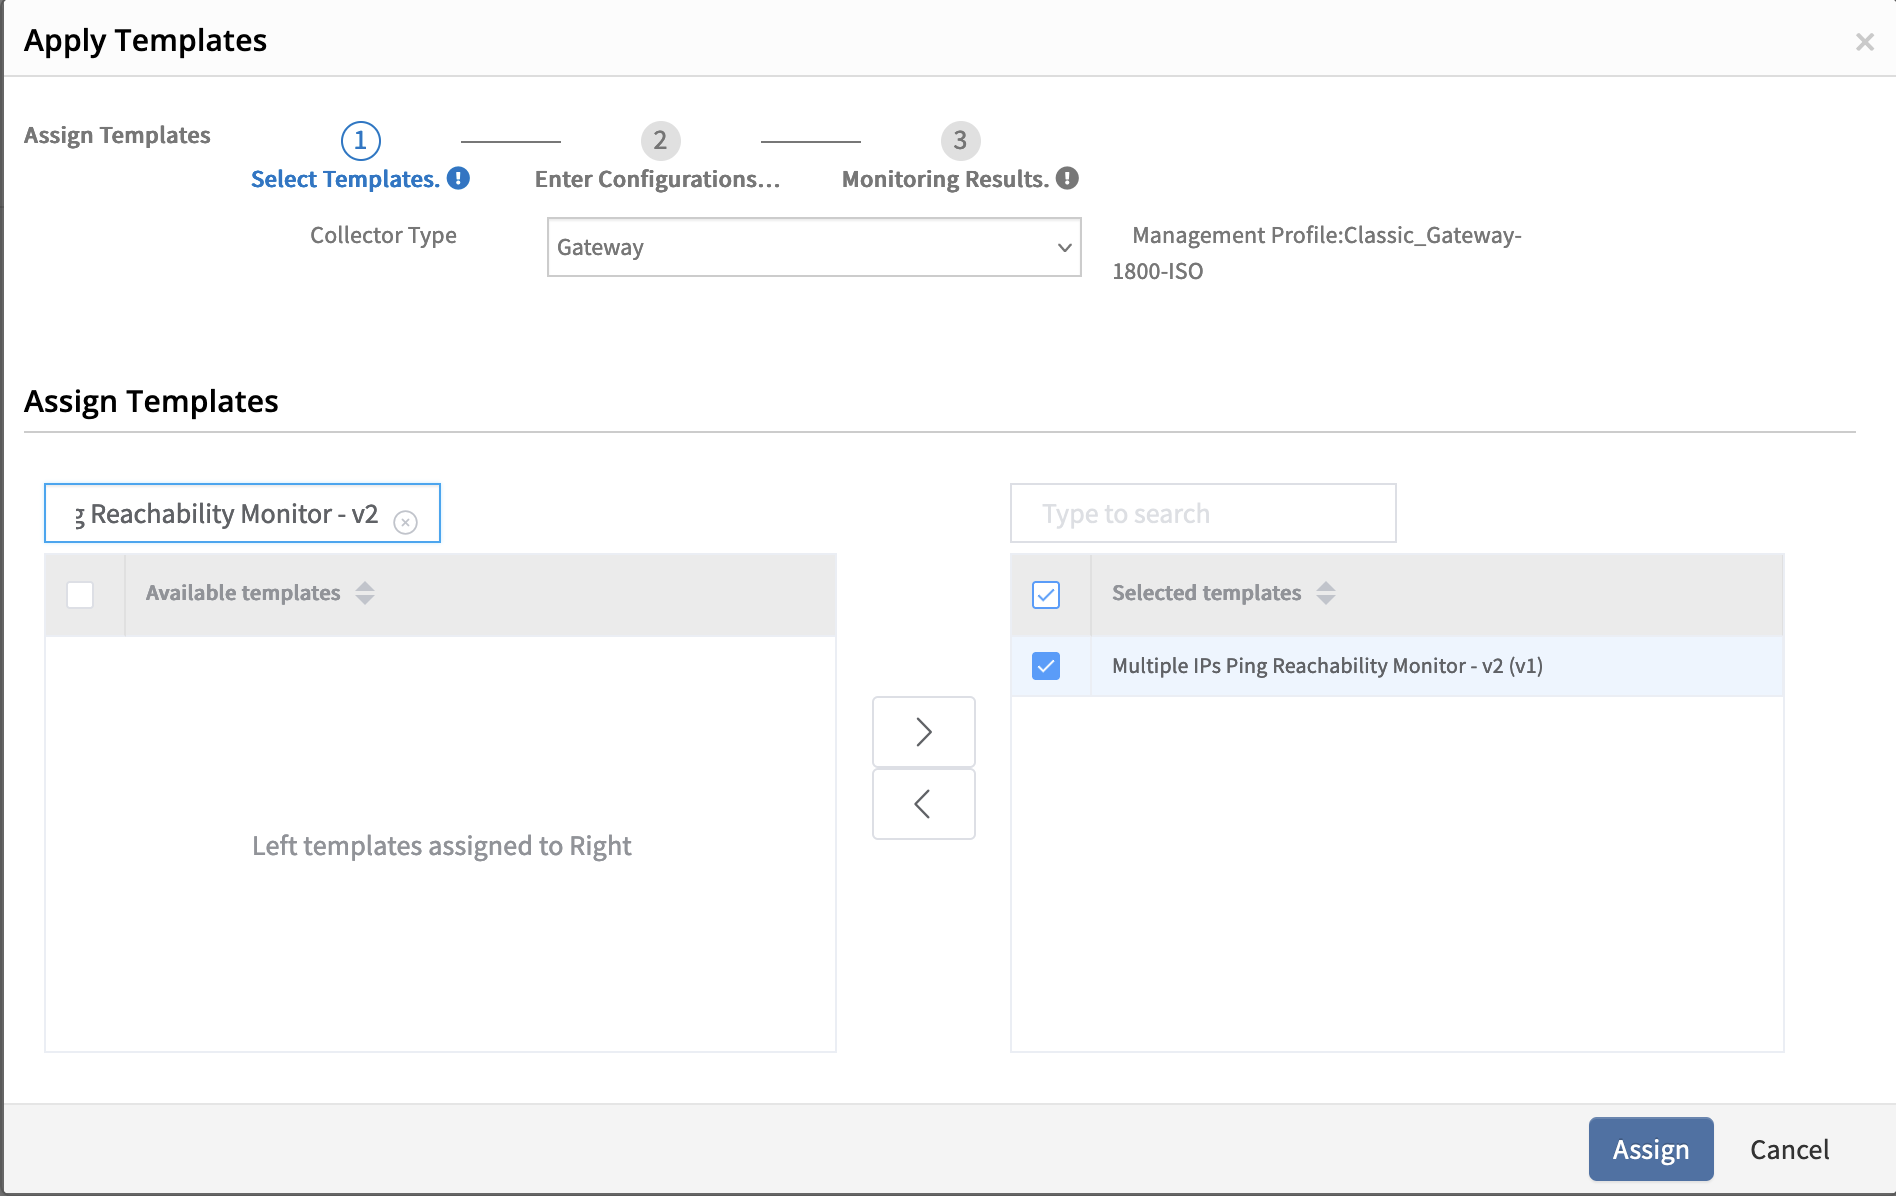
- From Select Templates Available templates, select Multiple IPs Ping Reachability Monitor template. Selected templates display the chosen templates.
Note: Select the Collector Type as Gateway. - Click Assign, which displays the Enter Configurations section.
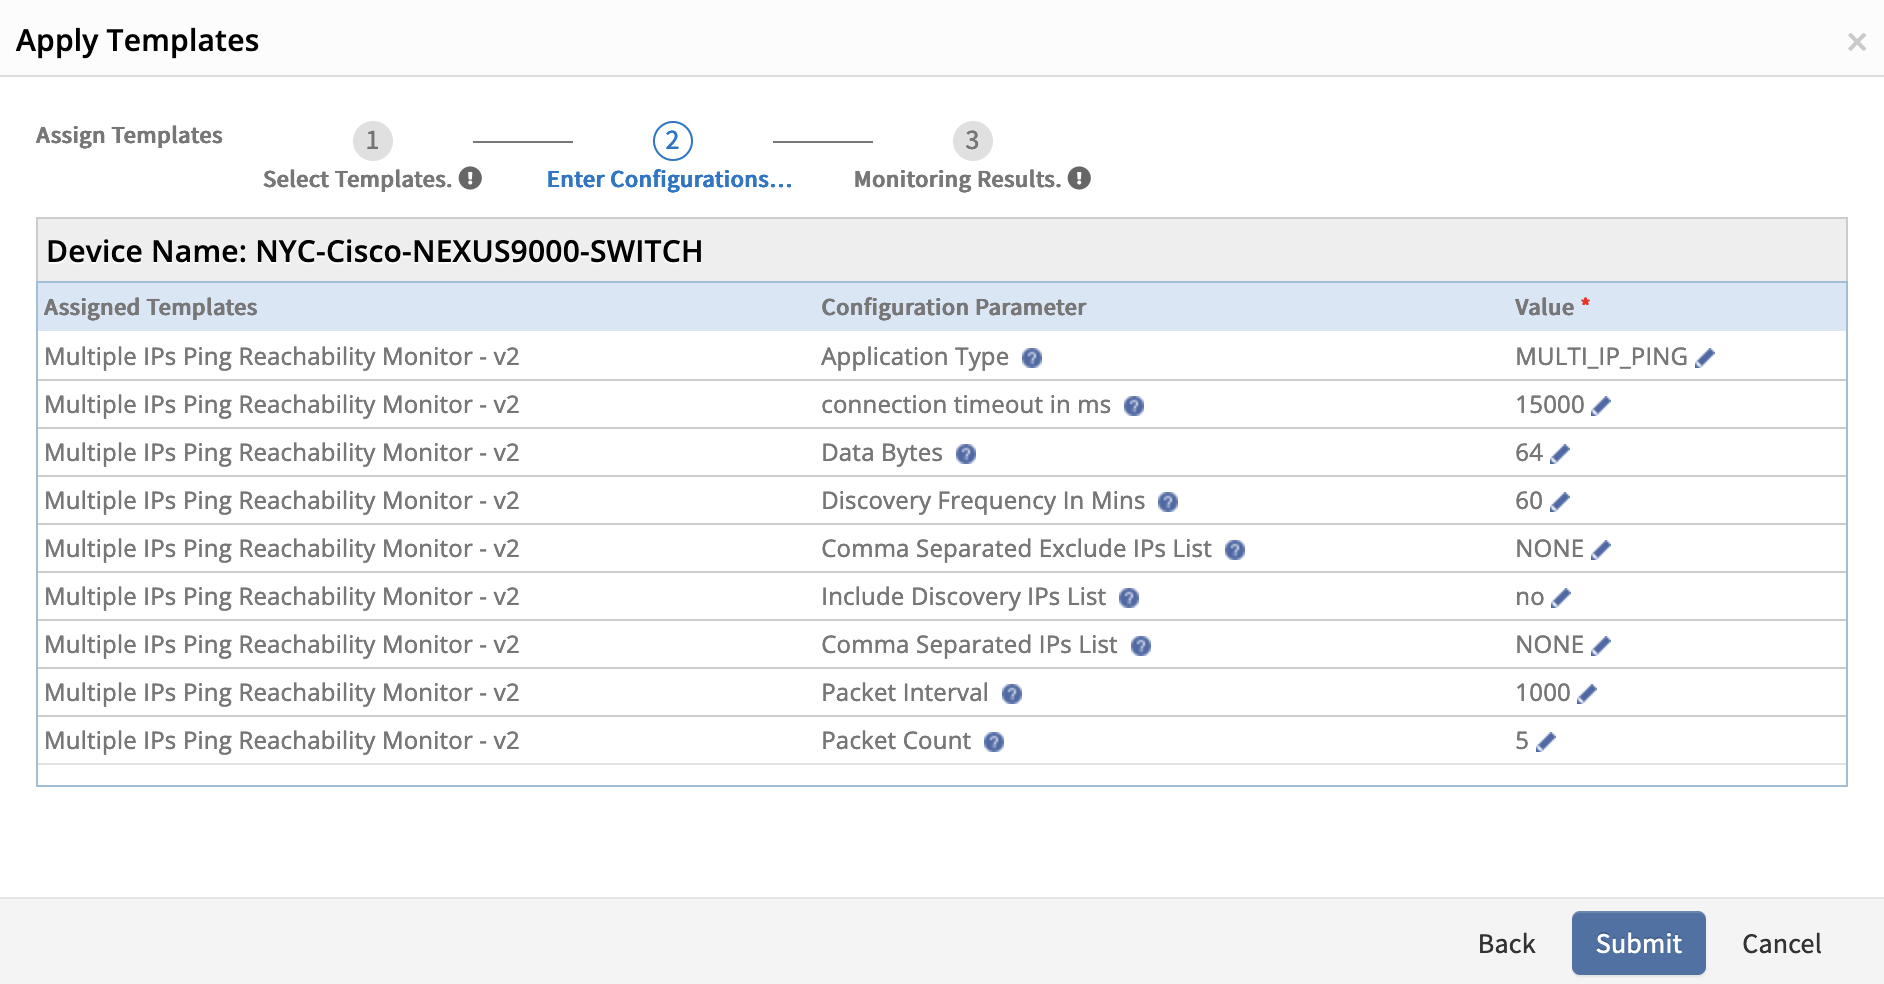
- Enter Value for the Assigned Templates and Configuration Parameters and click Assign.
The templates screen displays the selected templates.
Configuration Parameters
| Name | Display Name | Default Value |
|---|---|---|
| multi.ip.ping.reachability.data.bytes | Data Bytes | 64 |
| multi.ip.ping.reachability.pkt.interval | Packet Interval | 1000 |
| multi.ip.ping.reachability.pkts.count | Packet Count | 5 |
| multi.ip.ping.reachability.discovery.frequency | Discovery Frequency In Mins | 60 |
| multi.ip.ping.reachability.ip.list | Comma Separated IPs List | NoneProvide a comma-separated list of IP addresses. If the management IP is not reachable, these IPs will be used to check the device's reachability.NoteIf no alternative IPs are assigned to the device, the OpsRamp tool will automatically retrieve them using the SNMP protocol via the IP-MIB. |
| multi.ip.ping.reachability.exclude.ip.list | Comma Separated Exclude IPs List | NoneProvide a comma-separated list of IP addresses. The specified IPs will be excluded when evaluating the device's reachability.NoteYou can define IPs to exclude from reachability checks.This parameter is available from SaaS version 2025.06-U1 and works with gateway version 19.2.0 onwards. |
| multi.ip.ping.reachability.include.discovery.ip.list | Include Discovery IPs List | Yes/No If the parameter value is set to Yes, the tool considers both custom and discovered alternative IPs after excluding the HSRP IPs from the alternative IPs list. If the parameter value is set to No, the tool considers discovered alternative IPs after excluding HSRP IPs from the alternative IPs list, but if custom IPs are configured, it will only consider the custom IPs. NoteThis parameter is available from SaaS version 2025.06-U1 and works with gateway version 19.2.0 onwards. |
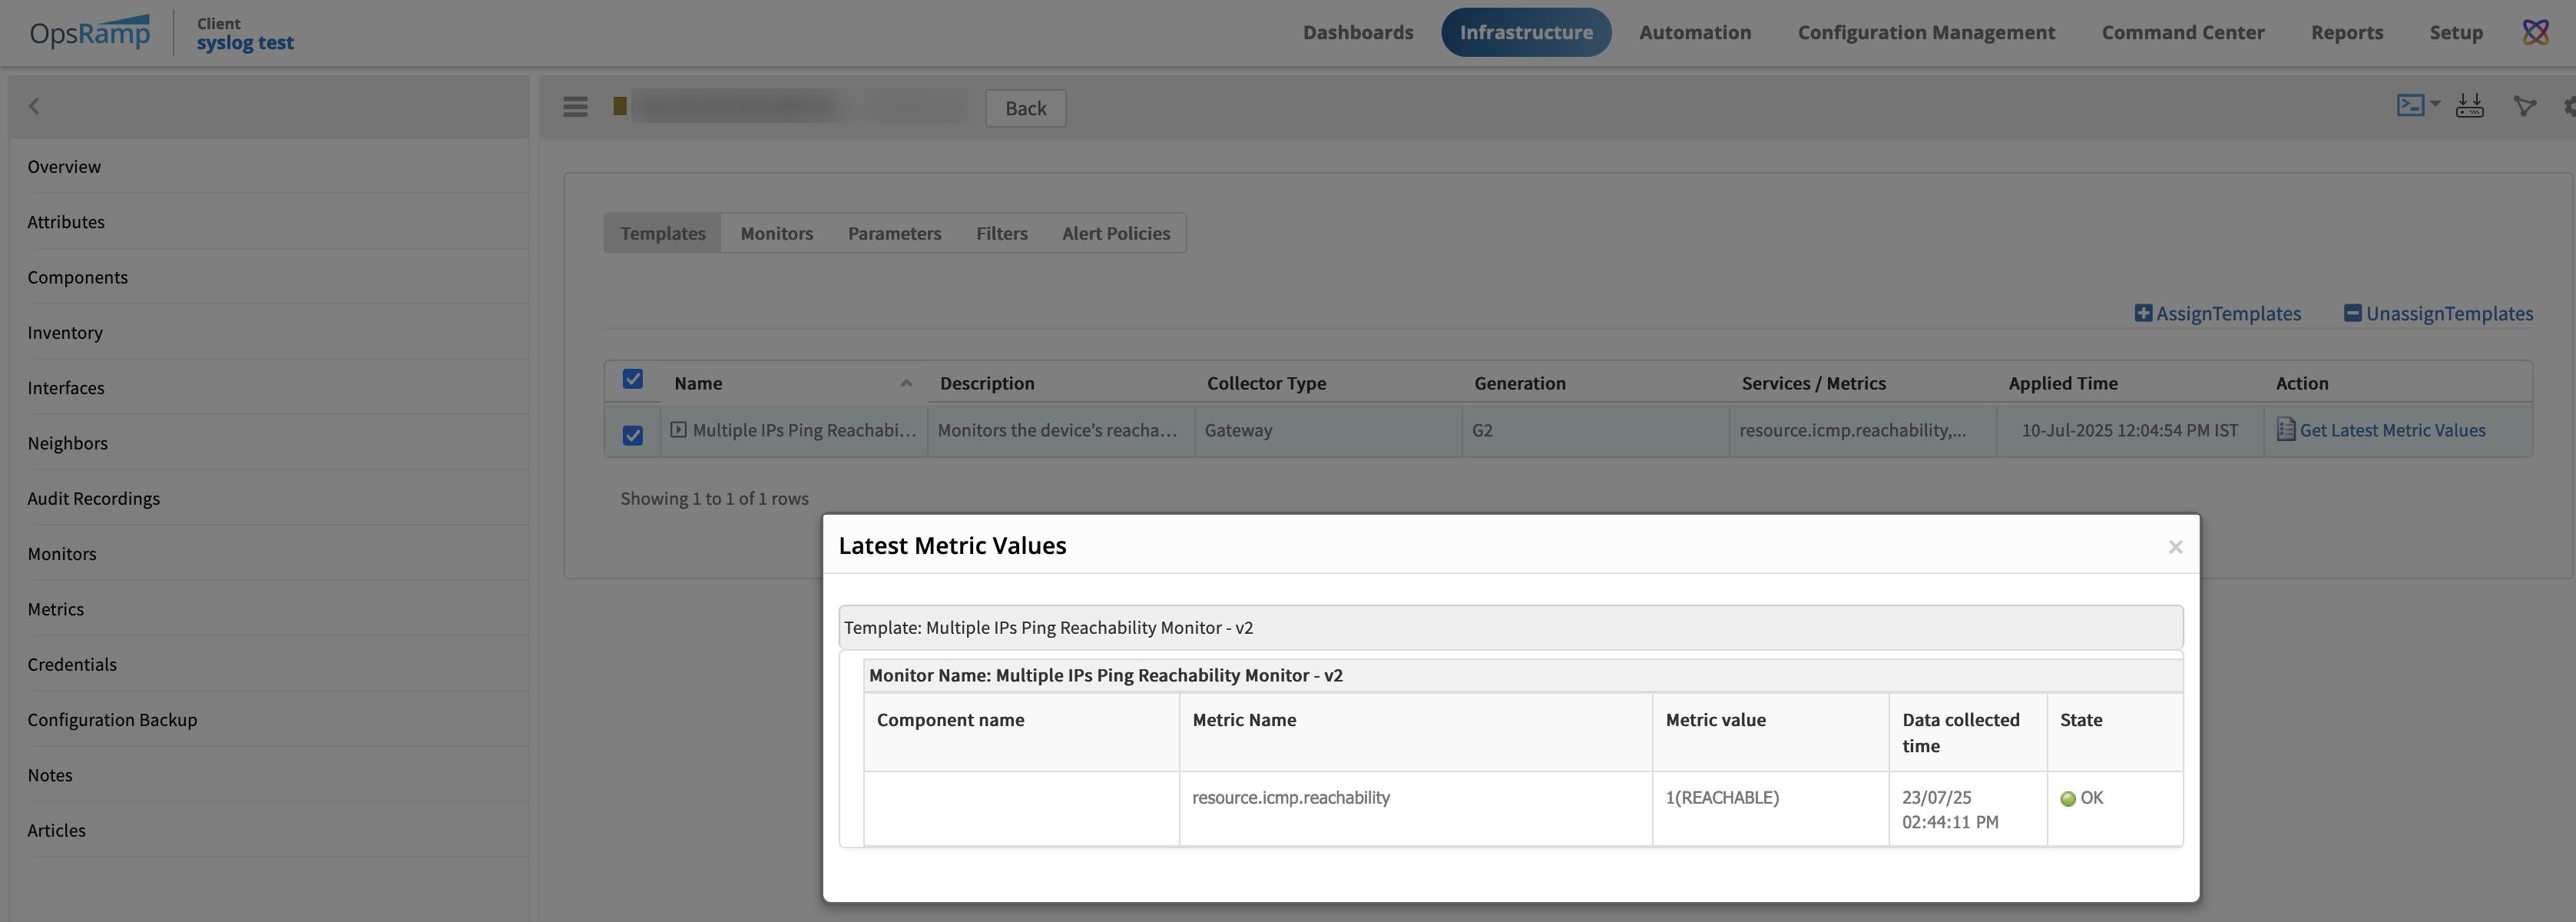
Get Latest Metric Values
To view latest metric values, select Metrics from the left side menu. Modify the time frame based on your requirement.
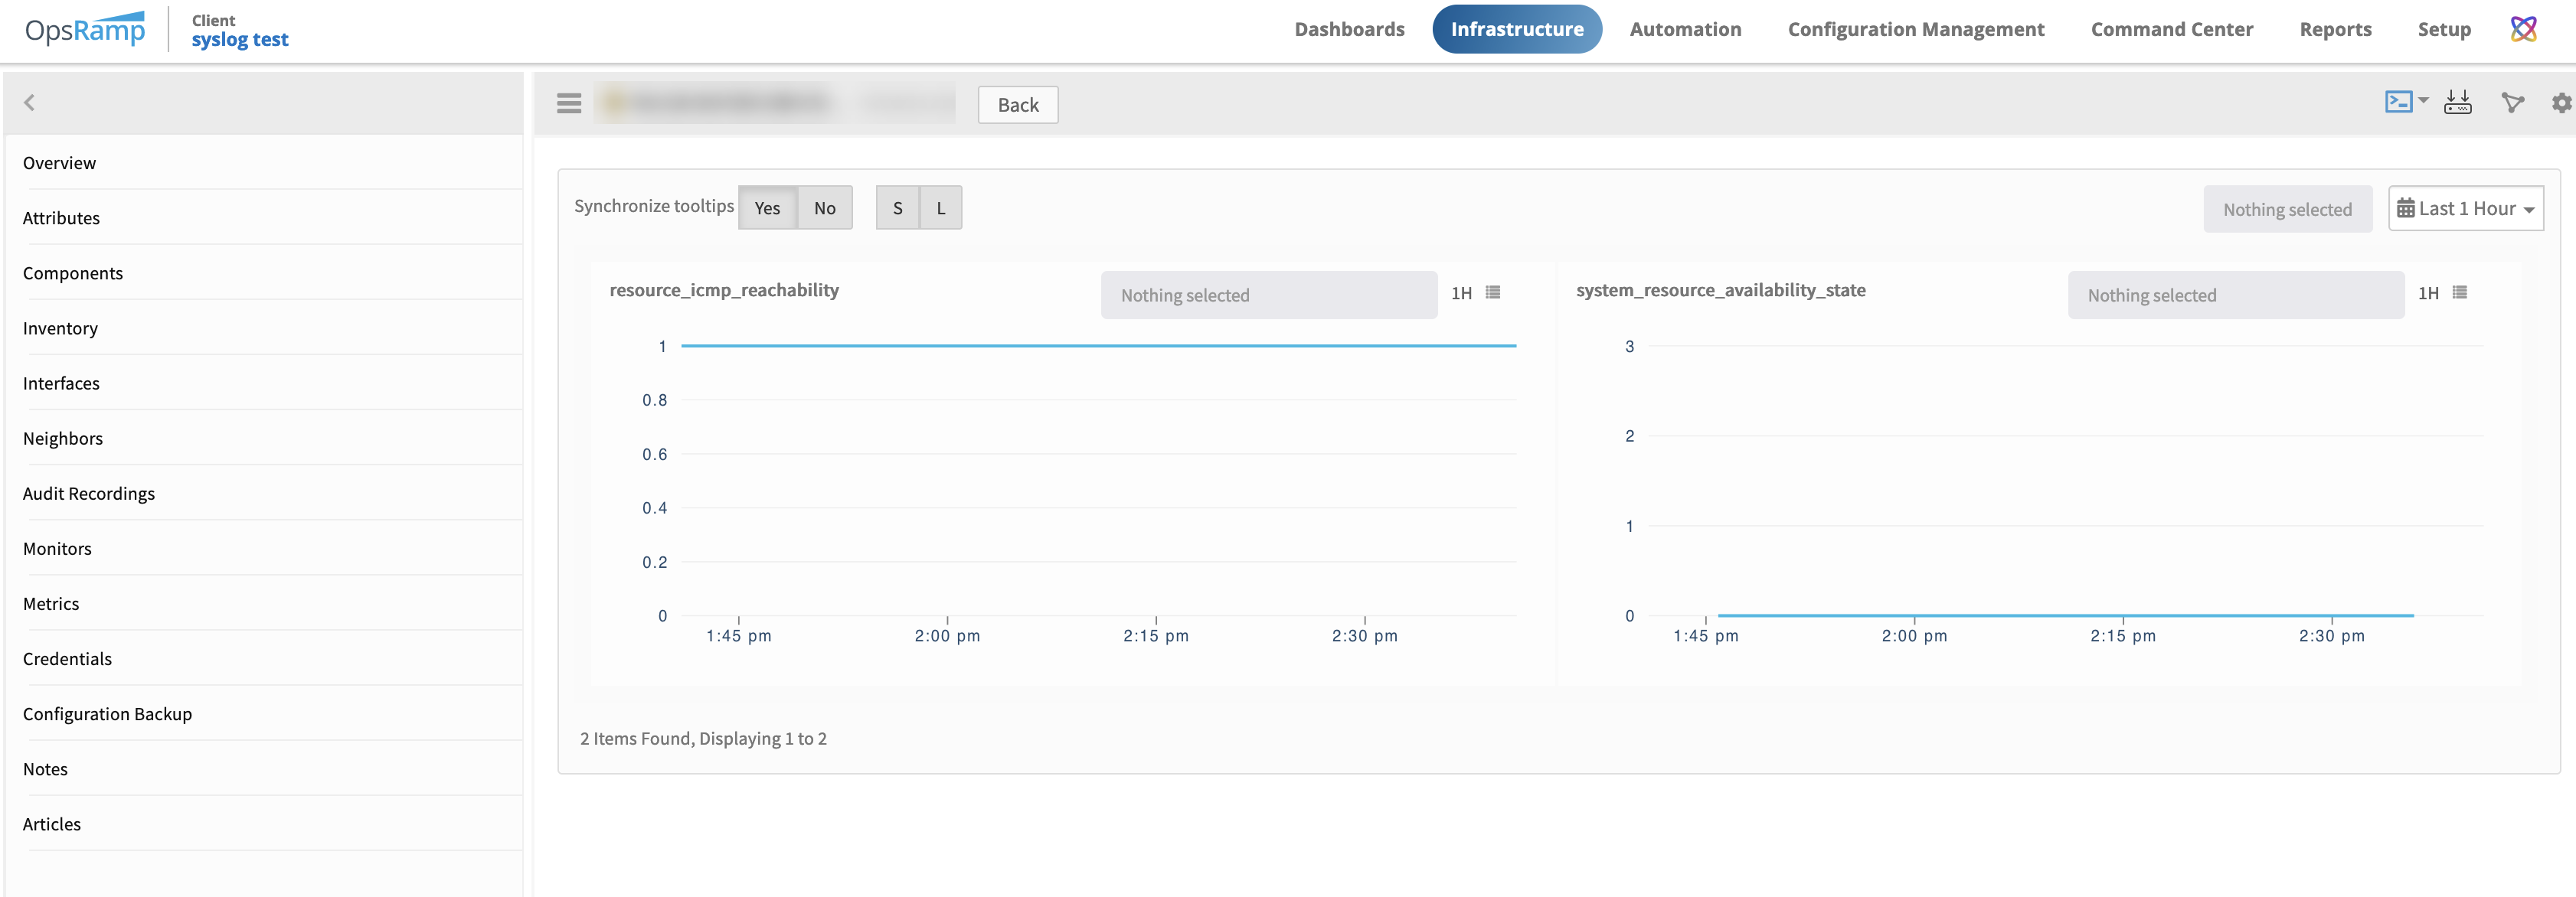
Graphical metrics representation
To view metrics in graphical representation, select Metrics from the left-side menu.
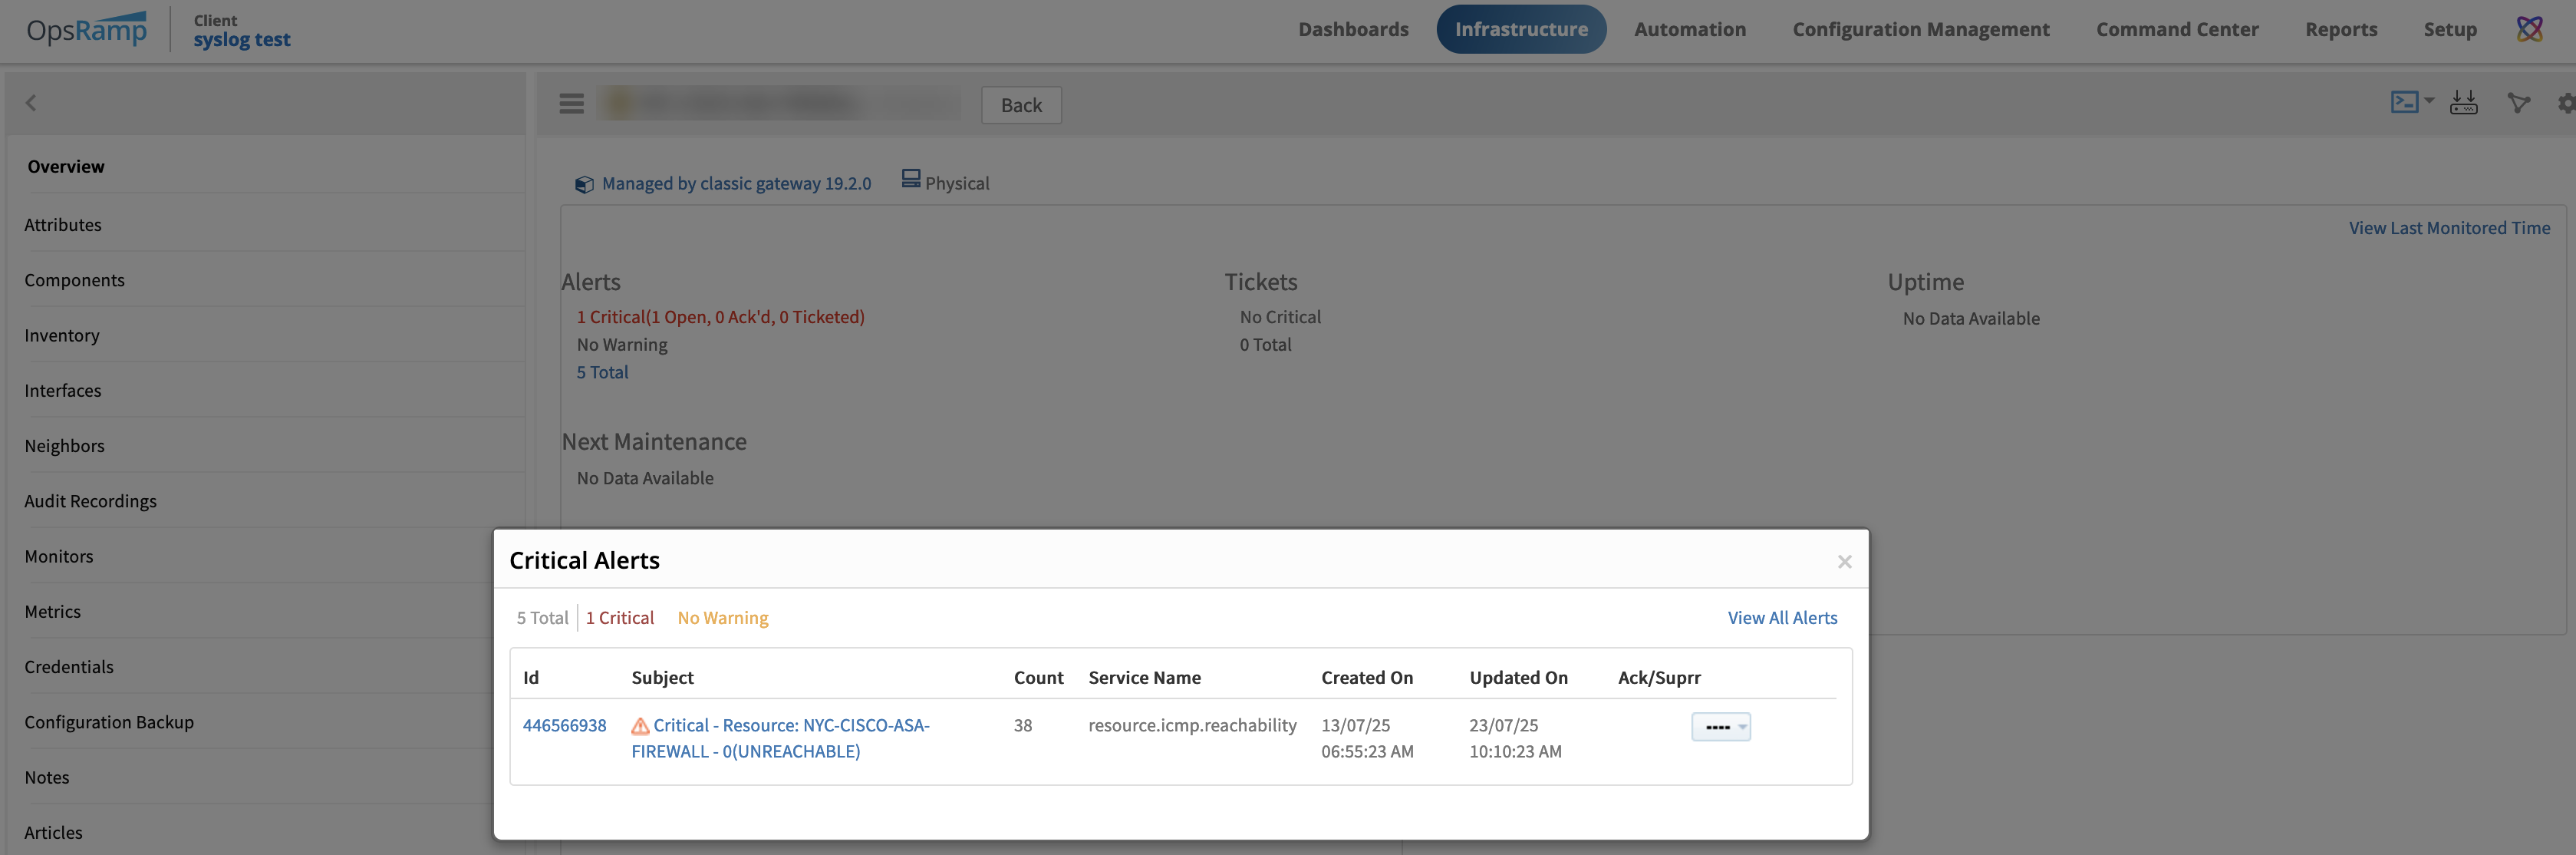
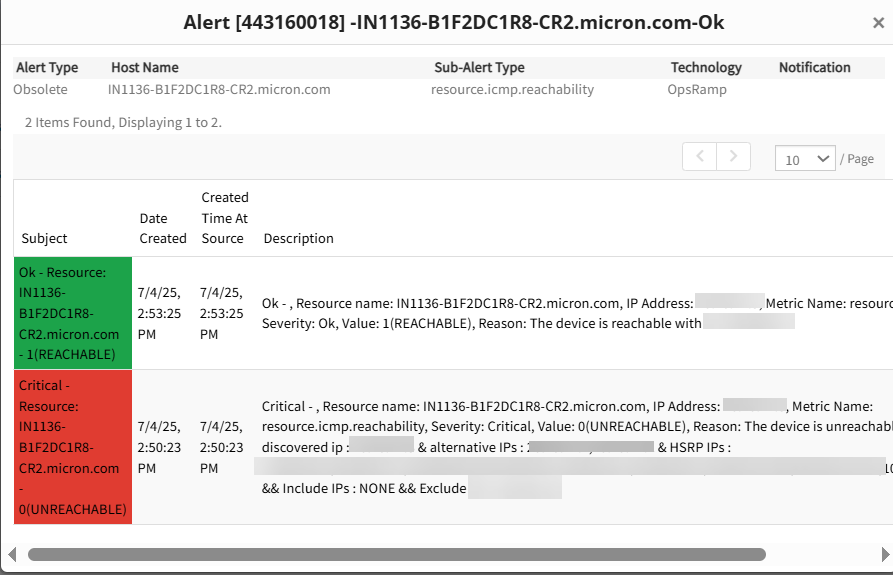
Sample Alert
To view Alerts, select Overview from the left side menu and then click on any alert to view details.
Troubleshooting
To check whether monitoring data is collected from the classic gateway:
- Log in to the gateway shell.
- Enter CLI mode by running the command:
gcli - Enable logging with the command:
flag add multi.ip.ping.log on 30 - Exit CLI using the command:
exit - View logs using:
tail -100f /var/log/app/vprobe.log
To verify whether monitoring data collected from the nextgen-gateway
- Login into gateway shell.
- Login to the vprobe container using the following command
kubectl exec -it nextgen-gw-0 -c vprobe -n <namespace> -- bashNote
Here we need to replace the<namespace>if applicable
otherwise executekubectl exec -it nextgen-gw-0 -c vprobe -- bash - Enable gateway CLI mode by using the command
gcli. - Execute
flag add multi.ip.ping.log on 30, and then exit from gcli throughexitcommand. - Use the command
tail -100f /var/log/app/vprobe.logto verify logs.