Introduction
Embed tiles allow you to incorporate data and visualizations from other tools and platforms into your dashboard.
For example, embedding interactive visualizations, videos, or other engaging content from Youtube can help keep users interested and engaged with the data and provide users with a comprehensive view to increase the liveliness of your dashboard.
Embed tiles allow you to make your dashboard a single pane of glass for visualizing telemetry data plus data from specific websites. This can help you to access all the relevant data in one place, which can save time and reduce the risk of errors.
Permissions
See Using RBAC for more information.
Create an Embed Tile
From DASHBOARDS → Dashboard, create a new dashboard or select from an existing dashboard collection.
See Create Dashboards to learn about creating dashboards.
Click CREATE TILE or + from the toolbar.
In the ADD TILE window, select Embed. The following screen is displayed:

Select one of the following:
Tile Option Functionality Build my own Visualize UI loading from embedded URL. Build My Own
Select the Build my own tab. This enables you to create a custom tile.

Enter a link in the EMBED LINK section.

Note: By default the Auto Refresh is set to Off, click the down arrow and select On to turn Auto Refresh to On.
Click the VISUALIZATION tab to customize the visualization further:
- HEADER: Set a name, color, size, and alignment for the header.
- HEADER: Set a name, color, size, and alignment for the header.
Click ADD TILE. The Embed tile is created and displayed on the main dashboard screen.
Examples
Following are some examples of embed URLs:
Example 1
The following example demonstrates embedding an external website that displays the current local time and related time zone information:
Enter the below URL in the EMBED LINK field:
- URL: https://time.is
- URL: https://time.is
Click the VISUALIZATION tab to customize the visualization further: HEADER: Set a name, color, size, and alignment for the header.
The preview will load the Time.is screen.
Note: The preview will only show if embedding is supported by the site.

Example 2
The following example demonstrates embedding an external dashboard that displays global cybersecurity attack data:
Enter the below URL in the EMBED LINK field:
Click the VISUALIZATION tab to customize the visualization further: HEADER: Set a name, color, size, and alignment for the header.
The preview will load the Worldwide Attacks screen.
Note: The preview will only show if embedding is supported by the site.

Example 3
The following example demonstrates embedding an external image using a direct image URL:
Enter the below URL in the EMBED LINK field:
Click the VISUALIZATION tab to customize the visualization further: HEADER: Set a name, color, size, and alignment for the header.
The preview will load the React logo screen.
Note: The preview will only show if embedding is supported by the site.

Example 4
The following example demonstrates embedding an external YouTube video using the correct embed URL format:
Enter the below URL in the EMBED LINK field:
- URL: https://www.youtube.com/embed/Wporyr3hr68
Note: Replace watch?v= in the original YouTube URL with embed/ to create a valid embed link.
- URL: https://www.youtube.com/embed/Wporyr3hr68
Click the VISUALIZATION tab to customize the visualization further: HEADER: Set a name, color, size, and alignment for the header.
The preview will load the YouTube video player screen.
Note: The preview will only show if embedding is supported by the site.

Click ADD TILE. The Embed tile is added and displayed on the Dashboard screen.

Example 5
The following example demonstrates embedding a service map using the correct embed URL format:
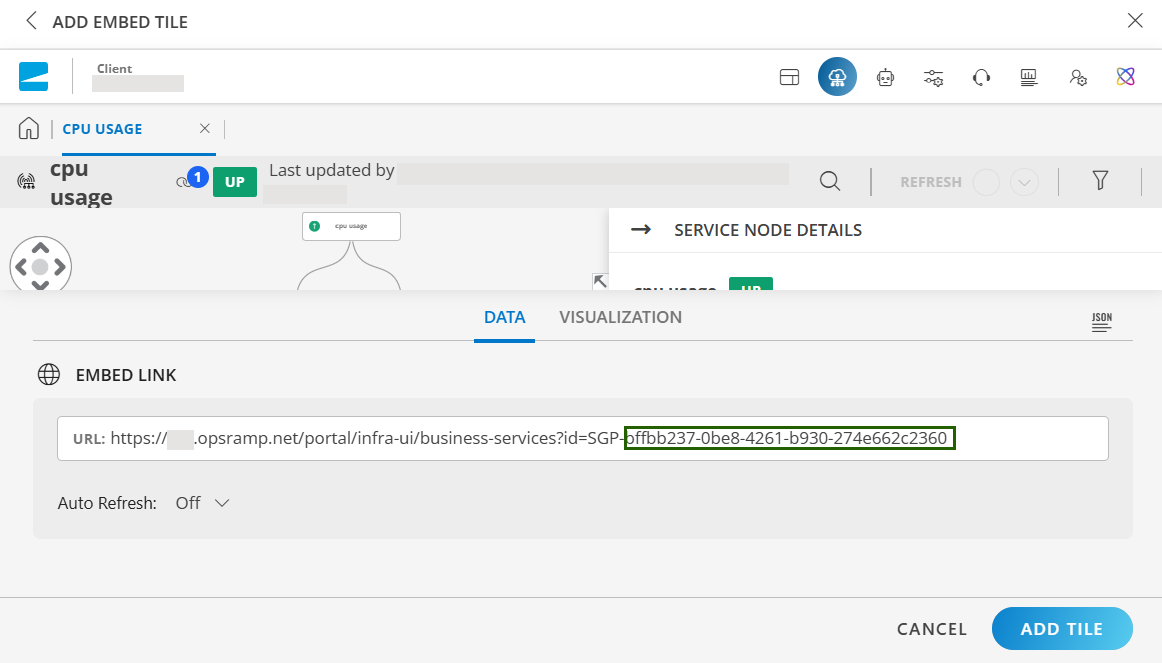
Enter the below URL in the EMBED LINK field:
Note
Replace app with your pod number. Also, after SGP- , add the node ID of the root node of the service map to create a valid embed link.
To get the root node ID, open the service map by navigating to Infrastructure > Service Maps. Click the root node. In the Service Node Details pane, click the ellipses (…) icon. Select Copy ID to copy the node ID. You can past this ID in the embed link after SGP-.Click the VISUALIZATION tab to customize the visualization further: HEADER: Set a name, color, size, and alignment for the header.
The preview will load the service map screen.
Note
The preview will only show if embedding is supported by the site.Click ADD TILE. The Embed tile is added and displayed on the Dashboard screen.
×